When a visualization is larger than the canvas, the Scale to Fit option can be used to scale the visual down to fit on the canvas. This is useful when working with grids or trellised charts that are too large to fit on the canvas, but small enough to be readable when scaled down. If the visualization is too large to be scaled down to fit onto the canvas, you will receive an error message.
Scale the Visualization
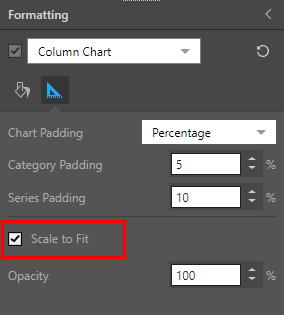
Toggle the Scale to Fit button from the Settings tab in the chart's formatting panel. Click once to scale down; click again to revert to full scale.

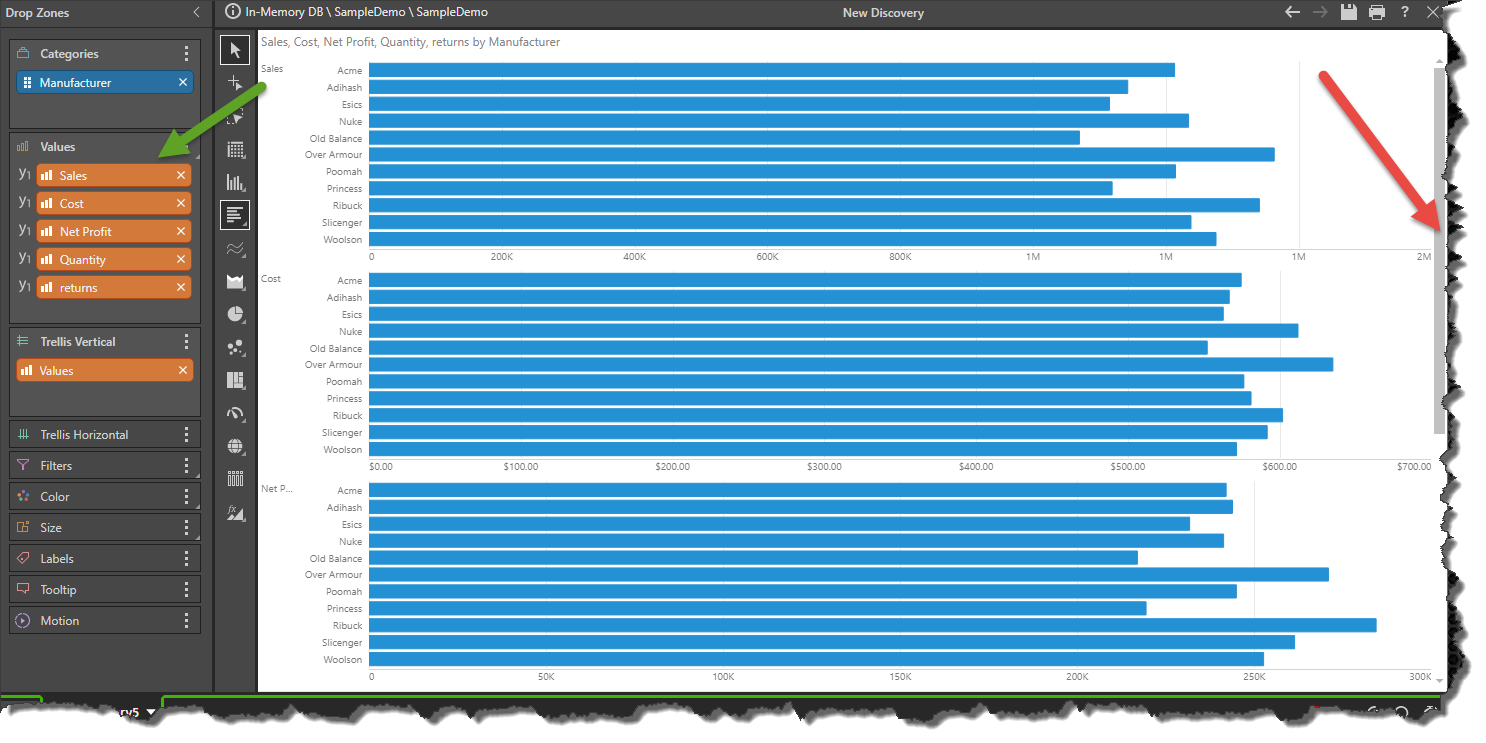
When working with trellised Cartesian charts, the Scale to Fit function is also exposed from the chart's Formatting panel:
In this example, the bar chart is trellised by 5 values (green arrow below). The charts do not fit onto the canvas, so the scroll bar (red arrow) must be used to view the lower charts.
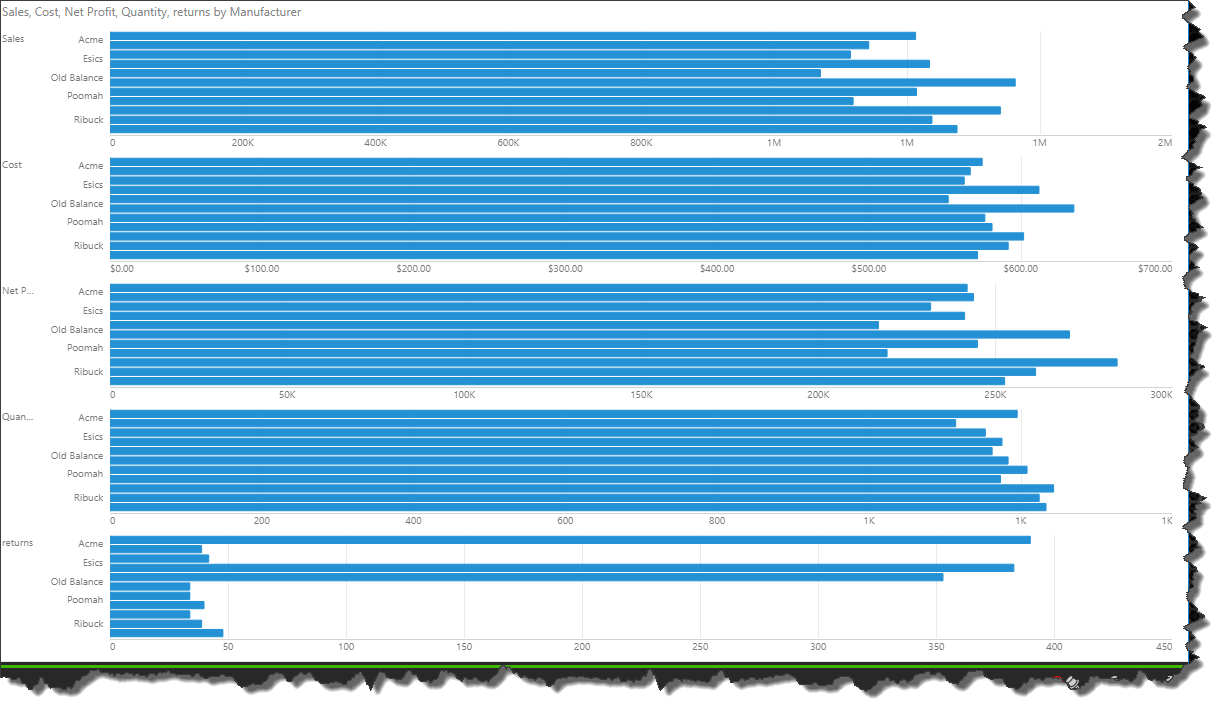
However, when the Scale to Fit button is enabled, all 5 charts are scaled down to fit onto the canvas: